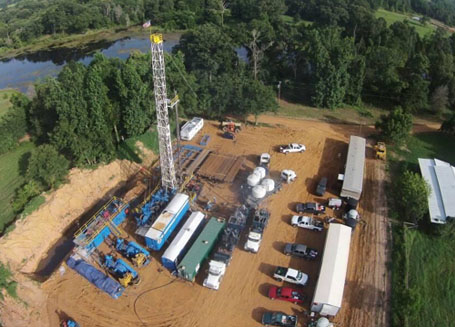
The U.S. oil rig count, produced weekly by oilfield-services company Baker Hughes, provides a nice barometer for the climate of domestic oil. When the count is high, chances are oil prices have been building (or stable at profitable rates) and there are many companies with their equipment and employees active. When the rig count is low, chances are oil prices dipped (or stayed low for an extended period) and companies have their equipment and people sidelined.
For perspective, the U.S. sat between a weekly count of 200 and 400 domestic rigs between 2000 and 2009. In 2010 the rig count climbed and by 2012, with oil prices sky high, the U.S. weekly rig count was above 1400. The count stayed right around 1500 until 2015 when oil prices crashed and dropped the rig count back to early 2000s levels (fluctuating again between 200 and 400 rigs).
Last week, which was the final week of 2016, Baker Hughes reported a U.S. rig count of 658, which was the highest of any weekly count throughout the year. In fact, the count was only 11 fewer than the U.S. started with in 2016. Sure, the count is nowhere near where it was before the crash in oil prices, but the U.S. did see steady growth in the number of rigs working domestically. The dramatic drop in oil prices we saw in 2015 forced companies to halt operations, limit new-starts and tighten their belts overall. Throughout 2016, as efficiency increased and the costs of equipment and oil-field services fell, oil companies slowly started breaking ground on new projects, which steadily increased the U.S. rig count.
What’s it mean? Well, the U.S. rig count is a sign that companies are finding ways to be profitable with oil prices around $50/barrel. In 2017 we should expect the U.S. rig count to continue to increase at weekly rates similar to the last quarter of 2016: about four or five additional rigs added each week. Unless, of course, we see a dramatic dip or spike in oil prices, which looks to be a ways into the future.

